The most basic of all principles that one must keep in mind while running a business is that it should turn a profit. A profitless business is not a business, but a liability, something that should be gotten rid of. Breaking even in a business is the presence of a certain number of sales to balance out its operating costs.
It is a minimum threshold for a profitable business or even one that is starting out to remain viable. In this blog, we shall consider the various steps involved with a Break-Even Analysis.
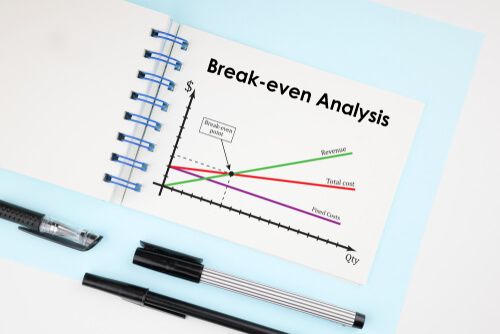
What is Break-Even Analysis?
Break-even analysis involves a company safety margin based on collected sales and related costs to be measured and analysed. In other words, the study shows how many profits are necessary to cover business costs. This break-even analysis determines the revenue requirements to cover the generally fixed costs of the company by analysing different levels of prices in relation to diverse demand levels. A demand analysis gives a seller lots of information on their sales skills.
Let's say your firm is a manufacturer of soft toys. This entails various input costs ranging from labour costs, raw material costs, machinery costs to transporting finished products, ensuring their visibility in the marketplace, marketing, and advertising. The Break-Even point would be the number of soft toys you need to sell before you are able to recover costs entailed to the point of the sale, and after which additional sales will turn a profit.
One obviously calculates profits for individual products, but that would not matter if enough of your products are not sold so that you can recover the costs that you have entailed to produce them. Break-Even Analysis benefits the producer of goods in that they are able to accurately ascertain the profit and loss margins they are being curtailed with.
Here are some Break Even Analysis benefits:
- Profit and loss are calculated at various levels of production and sales.
- You can estimate the impact of changes in sales prices.
- You can examine the connection between fixed and variable costs.
- Predict the impact of changes in cost and efficiency on profitability.
Types of Break-Even Analysis
- Average per-unit sales price (per-unit revenue)
- Average per-unit cost
- Monthly fixed costs

How does Break-Even Analysis work?
Break-even analysis will help you to determine which performance level you need or which revenue mix you want. In this form of analysis, the break-even point is determined (BEP). This break-even point is determined by the division by the price of a single unit less the variable cost of total fixed costs. Costs that do not change irrespective of the number of units sold are fixed costs.
Investors can use the calculation to calculate at what price they can break even on a trade or investment, even though they are not particularly interested in an individual company's break-even analysis of their revenue. When trading in or developing a plan to buy options or a fixed-income security product, the calculation comes in handy.
The amount of fixed costs is compared to the profit received from each additional unit generated and sold in a break-even study. A business with lower fixed costs would, on average, have a lower break-even point.
Break-Even Formula
The Break-even sales formula is a concept that addresses the contribution margin of a product. The contribution margin is the difference between the sales price of the product and its variable cost overall. This amount is the amount received to compensate the remainder of the fixed expenses not included in the calculation of the contribution margin.
Two equations can be used for the break-even analysis. In the first equation, the gross fixed costs are divided by the unit contribution margin. Assume that the total fixed costs in this case amount to up to 20,000. The point of breakthrough for a gift margin of ₹40 is 500 units (₹20,000 splits by ₹40), respectively. With 500 units sold, the full payment of all operating expenses and report a net profit or loss of ₹0.
The gross operating costs, alternatively, are split between the contribution margin ratio and an income break-even point. By multiplying the contribution margin per unit per sale price, the contribution margin ratio is calculated. OkCredit offers various features to monitor and maximise profitability for your break-even points.
The contribution margin ratio in the previous example is 40% (40 contribution margin per item / 100 sale price per item). As a result, the break-even point is ₹ 50,000 (20,000 total fixed costs divided by 40%). To validate this figure, multiply the break-even in units (500) by the sale price (₹100), which equals ₹50,000.
- Break-Even Point = Fixed Costs ÷ (Sales price per unit – Variable costs per unit).
- Margin of safety = (current output - break-even output)
- Margin of Safety% = (current output - breakeven output)/current output × 100
The strength of the company is the protection margin. It allows a company, above or below the break-even stage, to determine how much money it made or lost. The safety margin of an early-stage study is the amount by which real or expected sales exceed early-stage sales.
When dealing with budgets, you can substitute "Budgeted production" for "Current output." Profit/PV ratio if P/V ratio is given.

Limitations of Break Even Analysis
- It is difficult to distinguish between ‘fixed' and ‘variable' costs.
- There are some costs that are semi-variable. They are not taken into account in the analysis.
- Sales revenue and variable costs do not rise in lockstep with the cost of production. They are less proportionate than they should be at higher levels of production. This is due to trade discounts, bulk purchasing economies, concessions for higher sales, and so on.
- Because variable overheads are allocated on an estimated basis, the problem of under or over-recovery cannot be avoided.
- Pricing and comparing two jobs cannot be done without taking fixed costs into account.
Points to Remember
- The break-even analysis is just a supply-side (i.e., costs-only) analysis since it doesn't tell you much about how much the commodity can sell at these different prices.
- Fixed costs (FC) are assumed to be stable. While this is true in the short term, an increase in production size is likely to increase fixed costs.
- It assumes that average variable costs per unit of production are constant, at least in the context of possible sales quantities (i.e., linearity).
- It is presumptively assumed that the quantity of goods produced equals the number of goods sold (i.e., there is no change in the number of goods held in inventory at the beginning of the period and the number of goods held in inventory at the end of the period).
- It is assumed that the relative proportions of and commodity marketed and manufactured are constant in multi-product businesses (i.e., the sales mix is constant).

Break-Even Analysis Example
Colin is the chief financial officer of Company A, a water bottle manufacturer. He previously calculated Company A's fixed costs to total ₹100,000 and include property taxes, a lease, and executive salaries. A variable cost of ₹2 per unit is associated with the production of one water bottle. The water bottle has a high price tag of ₹12. To figure out when Company A's premium water bottle can break even, do the following:
Quantity needed to break even = ₹100,000 / (₹12 – ₹2) = 10,000
Given the fixed costs, variable costs, and the sale price of water bottles, Company A will have to sell 10,000 units to break even.
Conclusion
Break-Even Analysis can enable a business to measure profit and loss margins at various levels of an organisation, predict the effect of changes in sales prices and predict the effect of cost and efficiency changes on profitability.
Also read:
1) How to Use Google Adwords for Digital Marketing?
2) Tips & Tricks to optimise the Google Maps Listing for Your Business
3) Is Market Research Useful for a Small Business?
4) Top-10 Things & Technologies that will be trending in the year 2021
Stay updated with new business ideas & business tips with OkCredit blogs in English, Hindi, Malayalam, Marathi & more!
Download OkCredit now & get rid of your bookkeeping hassles.
OkCredit is 100% Made in India.
FAQs
Q. What is Break-Even Analysis?
Ans. Production managers and management accountants often use break-even analysis. It is focused on separating production costs into "variable" (costs that change as the product performance changes) and "set" (costs that remain constant) (costs not directly related to the volume of production).
Q. How do you calculate Break-Even Analysis?
Ans. To determine a break-even point based on units, use the following formula: Subtract the variable cost per unit from the fixed cost per unit. Fixed costs are those that remain constant regardless of how many units are sold. The revenue is the price at which you sell the commodity at fewer variable costs such as labour and materials.
Q. Why is Break-even Analysis so important?
Ans. A break-even analysis is an important component of a good business plan because it assists the company in determining the cost structures and the number of units that must be sold in order to cover the cost or make a profit.

![Series Funding [Types, How it works and More!]](https://okcredit-blog-images-prod.storage.googleapis.com/2021/02/seriesfunding1.jpg)
